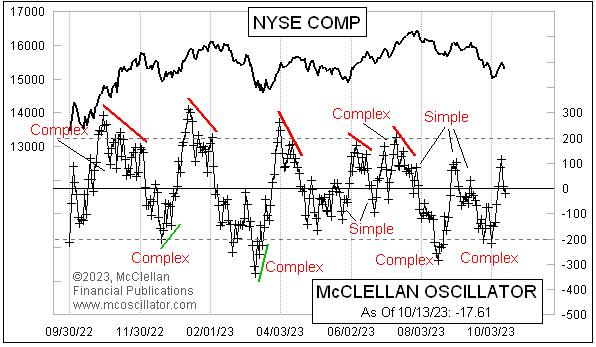
The McClellan Oscillator is a technical analysis indicator used to measure the market’s internal strength and identify cyclical trends in the stock market. Developed over thirty years ago by Sherman and Marian McClellan, the oscillator has since become a popular tool among investors and traders who want to measure the short-term strength of equity prices.
Since it’s based on the difference between two moving averages, the McClellan oscillator provides a straightforward overview of the stock market’s internal movement. This makes it an attractive indicator for novice and experienced traders alike.
The McClellan Oscillator typically operates between the levels of -80 and +80, with an overbought condition being signaled when the oscillator exceeds +80 and an oversold condition when it drops below -80. Furthermore, when the oscillator moves within the range of +40 to -40 it signals a neutral market. When the oscillator leaves the “zero” level on either side, this indicates that a shift in the underlying trend is occurring.
For example, when the oscillator moves above zero, the market is shifting towards bullishness. During such a situation, traders may look to take advantage of buying opportunities. On the other hand, if the oscillator drops below zero, a bearish shift is occurring and traders may look to take profits or open short positions accordingly.
The McClellan Oscillator is often used in conjunction with other technical indicators such as moving average convergence divergence (MACD) or relative strength index (RSI). It is also possible to combine the oscillator with price action strategies such as breakouts and trendlines.
Overall, the McClellan Oscillator is a simple and straightforward indicator that can provide investors and traders with a better understanding of market impetus and possible buying and selling opportunities. When the oscillator leaves the “zero” level and crosses on either side, it not only signals a possible trend shift but also the probability of greater fluctuations in the market. Knowing how to read and react to the oscillator’s movements in combination with other technical indicators can help traders make sound decisions about their investing and trading strategy.

