The stock market has been on a roller coaster ride this year, reaching unprecedented new highs in February before crashing just a few short weeks later. It appears now that the market has settled into a new, less volatile range – but how long will this last?
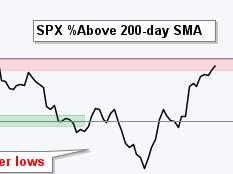
One way of measuring the sustainability of this new range is to look at what are known as long-term breadth indicators. These indicators measure the number of stocks participating in the market’s uptrend, which can indicate whether a market is on its way up or is about to rollover into a correction or bear market.
Recently, long-term breadth indicators have not been looking very good. The most widely-followed indicator, the New York Stock Exchange Advance-Decline Line, has been falling since the end of 2017. The number of stocks participating in the market’s gains has been steadily declining since last year, even as the market is still near all-time highs. This is an indication that the current levels of market growth could be unsustainable over the long term.
The situation has been further exacerbated by declines in the Market A/D Ratio, which measures the market’s up-to-down volume ratio. This ratio has fallen from around five a year ago to its current level of around three. This indicates that the market is losing not just breadth, but also depth – meaning that fewer stocks are participating in the market’s gains, and that those gains are becoming less sustainable over the long term.
The declines in both the New York Stock Exchange Advance-Decline Line and the Market A/D Ratio could be indicative of an impending correction or bear market. While these declines can sometimes precede a strong rally, this doesn’t seem likely in the current environment. Instead, they are signaling that the needle of investor sentiment may finally be hitting its breaking point.
Ultimately, investors should keep a close eye on these long-term breadth indicators in order to gauge the sustainability of the current market range. If the New York Stock Exchange Advance-Decline Line and Market A/D Ratio continue to decline, it could be a sign that the market is headed for a long-term correction or bear market – and now could be the moment of truth.

